
FRCA graphs, waveforms and equations
222 Graphs & Science items for anaesthesia physiology and pharmacology revision: each one built around a clear graph, waveform or schematic, with the explanation you need to describe it.
Subscriber? Sign in and open GAG from your course.
Graphs you can explain, not just recognise
Much of Primary FRCA revision, and a good part of the Final, rests on graphs: dissociation curves, pressure–volume loops, capnograms, pharmacokinetic curves and the physics behind monitoring. Graphs & Science draws each one cleanly, with labelled axes and the key points marked, so you can learn the shape and the reason for it.
Each item gives you:
- the graph, waveform or schematic, with a written Description of the visual;
- Explain in 60 seconds, a short structured explanation to say aloud;
- equations and worked examples where the topic has them;
- Reveal labels on labelled diagrams, and self-test questions on many items;
- exam-focus prompts for Primary Written, Primary Practical, Final Written and Final Practical.
Interactive anaesthesia graphs
26 items have an interactive version. Choose a pattern, move the sliders and read the values as the curve changes; then switch to Test yourself. They are teaching models with illustrative values. The interactive items are:
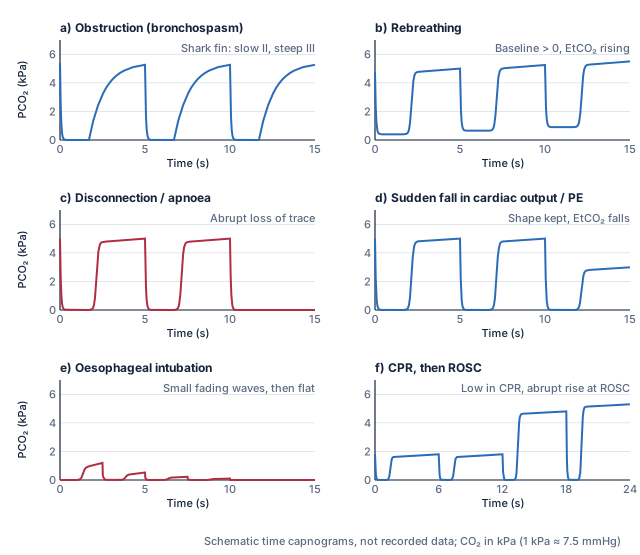
- Abnormal capnograms: obstruction, rebreathing, disconnection, low output, oesophageal tube
- Capnography: normal time and volumetric capnograms, dead space and EtCO2 versus PaCO2
- Competitive and non-competitive antagonism and the Schild plot
- Dose–response curves: linear and log axes, potency, efficacy and slope
- Dynamic assessment of fluid responsiveness
- Ejection fraction
- Exponential function, time constant and logarithms
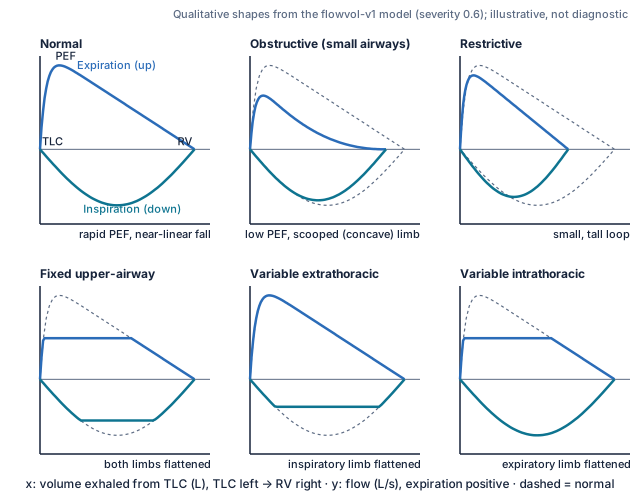
- Flow–volume loops: normal, obstruction, restriction and upper-airway patterns
- Frank–Starling relationship
- Half-life, time constant, accumulation and washout
- Left ventricular pressure–volume loop
- Likelihood ratios, Bayes and the Fagan principle
- LV pressure–volume loops in valve disease
- Oxygen–haemoglobin dissociation curve and the Bohr effect
- Patient–ventilator dyssynchrony on matched ventilator traces
- Predictive values and prevalence
- Preload, afterload and contractility
- Pressure-controlled ventilation: traces and variable tidal volume
- PV loops in systolic and diastolic heart failure
- Receptor occupancy and response: spare receptors, partial and inverse agonists
- Sensitivity, specificity and test thresholds
- Venous return and cardiac function curves (Guyton)
- Ventilator traces: peak, plateau, driving pressure, auto-PEEP and time constants
- Ventilatory response to CO₂: threshold, slope and shifts
- Ventilatory response to hypoxia and the peripheral chemoreceptors
- Volume-controlled ventilation: flow delivery, pressure response and limits
For written preparation, pair graphs with the Primary Written textbook and question bank; for spoken practice, with Primary Practical.
Topics you will find in Graphs & Science
A selection of 42 published titles. The topic directory lists all 222.
Capnography and pressure waveforms
- Capnography: normal time and volumetric capnograms, dead space and EtCO2 versus PaCO2
- Abnormal capnograms: obstruction, rebreathing, disconnection, low output, oesophageal tube
- Normal central venous pressure waveform
- Abnormal central venous pressure waveforms
- Arterial pressure waveform: amplification, dicrotic notch and artefacts
- Damping, natural frequency and the fast-flush test
ECG
- The normal ECG: calibration, intervals and a systematic read
- Bradycardia, heart block and pacing: ECG recognition
- Tachyarrhythmias: ECG recognition
- Cardiac axis and corrected QT (QTc)
Brain and neuromonitoring
- Cerebral autoregulation: blood flow versus perfusion pressure
- Cerebral blood flow: responses to PaCO2 and PaO2
- Intracranial pressure–volume relationship and compliance
- EEG and processed EEG depth-of-anaesthesia monitoring
- Evoked potential monitoring: SSEP, MEP and anaesthetic effects
Respiratory physiology and gas exchange
- Flow–volume loops: normal, obstruction, restriction and upper-airway patterns
- Forced expiration: volume–time curve, FEV1/FVC and reference limits
- Oxygen–haemoglobin dissociation curve and the Bohr effect
- Oxygen cascade
- Shunt and the shunt equation
- Alveolar gas equation and the A–a gradient
Cardiovascular mechanics and oxygen delivery
- Left ventricular pressure–volume loop
- Frank–Starling relationship
- Law of Laplace: spheres, cylinders and wall stress
- Oxygen flux: delivery, consumption and extraction
- Dynamic assessment of fluid responsiveness
- Exercise physiology and cardiopulmonary exercise testing (CPET)
Pharmacokinetics and pharmacodynamics
- Context-sensitive half-time and decrement times
- One-, two- and three-compartment models
- Effect site, ke0 and hysteresis
- Dose–response curves: linear and log axes, potency, efficacy and slope
- Competitive and non-competitive antagonism and the Schild plot
Renal clearance and CRRT
- Renal clearance
- CRRT dose, filtration fraction and solute kinetics
- CRRT modes: convection, diffusion, dilution and anticoagulation
Physics, measurement and equipment
- Ideal gas equation and Dalton's law of partial pressures
- Laminar and turbulent flow and the Reynolds number
- Electricity basics: current, voltage, resistance, impedance, AC and DC
- Wheatstone bridge and strain-gauge pressure transducers
- Pulse oximetry: principle, calibration and limitations
- Vaporisers: variable bypass, desflurane and electronic designs
- Mapleson breathing systems A–F
What a GAG visual looks like
Frequently asked questions
Which graphs should I be able to draw for the FRCA?
There is no official list, and not every exam format asks you to draw. GAG marks each item as high-yield, often examined or background for each exam, which helps you decide where to spend time. Practise the ones marked high-yield for your exam until you can sketch and explain them from memory.
Are the graphs interactive?
26 graph items have an interactive version as well as the drawing; the rest are static diagrams. Interactive versions are teaching models with illustrative values, not patient predictions.
Do the graphs use real patient data?
No. The graphs are schematics: shapes and values are chosen to show the relationship clearly, and each visual says so where it matters. They are for understanding and drawing practice.
Is this enough for Primary FRCA physics and clinical measurement?
GAG covers many of the graphs, equations and devices you need to explain, but it is not a complete course. In Primary Written, use it alongside the interactive textbook and SBA practice; in Primary Practical, alongside the learning hub and examiner practice.
Continue: Anatomy · Guidelines & Tables · GAG overview
GAG comes with full access to every course
GAG is included in Primary Written, Primary Practical, Final Written and Final Practical, with exam-focus prompts for each.
The free preview does not include GAG.
Already registered? Sign in